

Assessing the scope for compensatory fiscal measures in response to the recent energy shock
Prepared by Othman Bouabdallah, Cristina Checherita-Westphal and Philip Muggenthaler-Gerathewohl
Published as part of the ECB Economic Bulletin, Issue 5/2026.
The recent global energy shock has affected the economies and public finances of euro area countries, but there are significant differences compared with the 2022 energy crisis.[1] This box first discusses the differences between the fiscal policy conditions prevailing at the onset of the recent energy crisis and those observed following Russia’s invasion of Ukraine in February 2022. It then presents an overview of the discretionary fiscal policy support that euro area governments have provided since the 2026 shock and assesses the scope for self-financing measures.
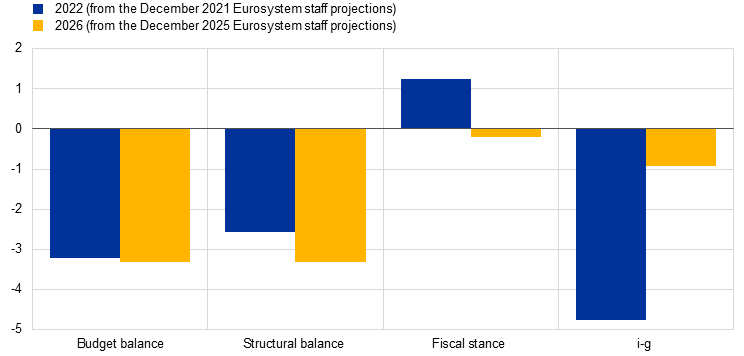
While euro area fiscal positions appeared broadly similar at the onset of the 2022 and 2026 energy shocks, a closer look reveals that fiscal room is more limited today (Chart A, panel a). Euro area governments were expected to run broadly similar aggregate deficits of 3.2% and 3.3% of euro area GDP prior to the crises in 2022 and 2026 respectively. However, in 2022, pent-up demand fuelled by COVID-19 pandemic-induced high precautionary savings and income support policies contributed to a strong recovery in growth, tax bases and government revenues, whereas these conditions are not present in 2026. If cyclical and other temporary factors are stripped out, the projected euro area structural fiscal deficit stands at 3.3% for 2026, compared with a pre‑energy‑shock projection of 2.6% for 2022. Pre-crisis government plans in 2022 also entailed a tightening fiscal stance given the withdrawal of some pandemic support, which created space to respond to a larger and more broad-based energy shock than the current one.[2] By contrast, the euro area fiscal stance was projected to loosen in 2026, even before the outbreak of the Middle East war, largely on account of major defence and infrastructure spending plans adopted by Germany and other smaller euro area members of the North Atlantic Treaty Organization.
Chart A
Fiscal positions prior to the 2022 and 2026 energy shocks
a) Euro area budgetary indicators
(budget balance: percentages of GDP; structural balance and fiscal stance: percentages of potential GDP; interest rate-growth differential (i-g): percentage points)
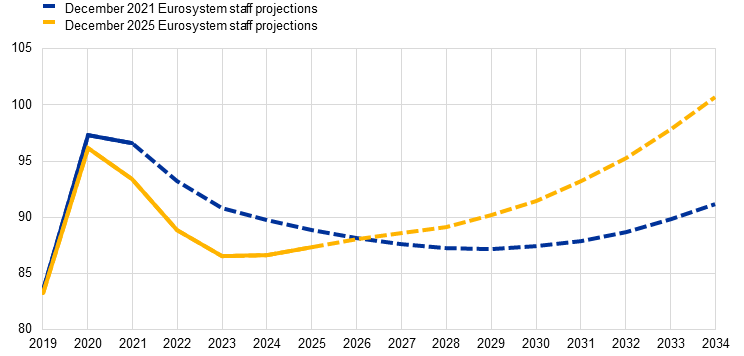
b) Euro area debt outlook
(percentages of GDP)
Sources: Eurosystem staff macroeconomic projections for the euro area, December 2021 and December 2025, and related debt sustainability analyses.
Notes: Panel a): i-g stands for interest rate-growth differentials on government debt. The fiscal stance is measured as the change in the cyclically adjusted primary balance (adjusted for Next Generation EU grants on the revenue side). A negative (positive) figure implies fiscal stance loosening (tightening). Panel b): the dashed segments represent projected debt ratios, which replicate the baselines until the end of the respective horizons (t+3) and are extended assuming constant structural balances net of ageing costs.
The debt outlook is also less favourable now, as higher financing costs leave governments with less room for manoeuvre than the stock of debt alone would suggest (Chart A, panel b). Although the aggregate euro area government debt ratio was broadly comparable at the start of the two episodes in 2022 and 2026 (close to 89% of GDP), the cost of debt refinancing has increased materially. In 2022, sovereign borrowing costs were near historic lows and the strong post-pandemic growth rebound contributed to strongly negative interest rate-growth differentials (Chart A, panel a). By contrast, with higher policy rates and term premia in 2026, that fiscal buffer has been largely depleted and long-term euro area debt projections under a “no fiscal policy change” scenario after 2028 now point to significantly more adverse dynamics.
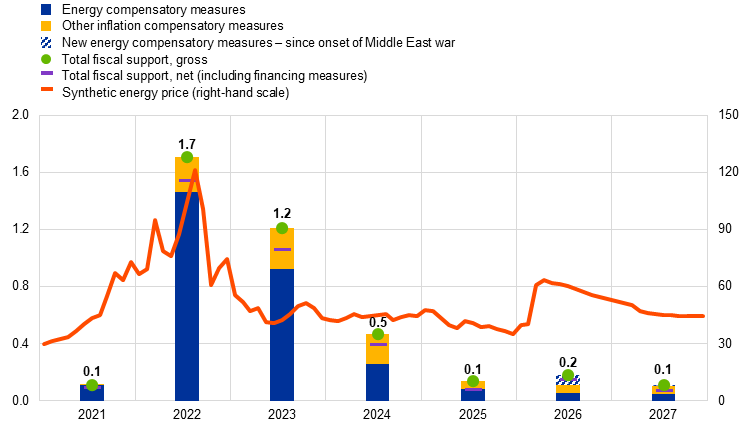
Partly reflecting the above considerations, euro area governments have adopted discretionary fiscal policy support to a far more limited extent in response to the Middle East war than in the past (Chart B). Discretionary support since the outbreak of the war amounts to around 0.1% of GDP at the euro area aggregate level and has primarily taken the form of temporary measures for 2026 (blue and white striped bars in Chart B; see also Chart C). The remaining measures for 2026 and 2027 are still in place from the 2022 episode. The limited nature of recent fiscal support may partly reflect lessons from the past, including the high costs of the compensatory measures taken in 2022 and 2023. While these measures helped smooth inflation, they also increased its persistence and strengthened the case for preserving the signal embedded in energy prices and thereby supporting the European green transition.[3]
Chart B
Euro area energy and inflation compensatory measures since 2021
(left-hand scale: percentages of GDP; right-hand scale: USD/MWh)
Sources: June 2026 Eurosystem staff macroeconomic projections for the euro area (cut-off date 27 May 2026) and LSEG.
Notes: Energy prices are shown as at the cut-off date for the technical assumptions (21 May 2026) underlying the June 2026 projections. For 2026 and 2027, energy support since the onset of the Middle East war (striped blue and white bars) includes new measures and a limited impact of higher energy prices on existing support schemes in a few countries. The remaining support over 2026 and 2027 refers to other lasting effects of the energy and inflation compensatory measures approved in the context of the 2022 energy crisis. The synthetic energy price is calculated as a weighted average of the oil price (converted to USD/MWh) and the gas price (in USD/MWh), with the weights based on the euro area’s energy import shares of oil and gas.
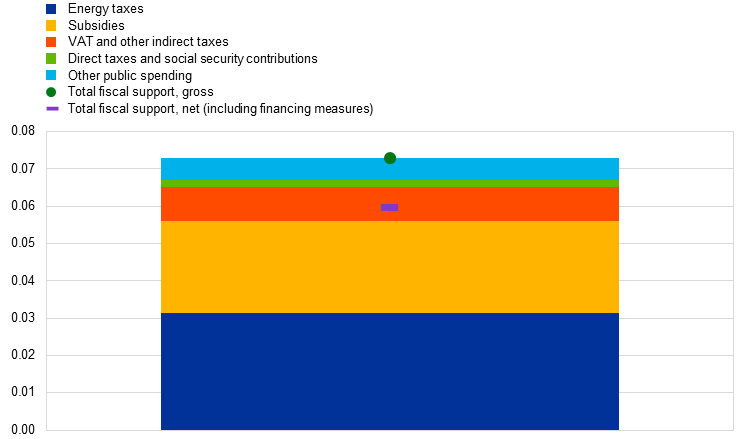
The new fiscal measures mainly comprise temporary cuts in energy taxes and increased subsidies for fuels, transport and electricity (Chart C, panel a). These have been complemented by reductions in valued added tax (VAT) rates on energy products in some countries and other spending and tax measures. So far, about 60% of the gross fiscal cost comprises (mainly untargeted) direct price measures, while the remainder operates through (somewhat targeted) income support or other compensation channels. Around two-thirds of the support is directed at households and one-third at firms. Only a few countries have adopted discretionary financing measures, such as cuts in fiscal transfers or increases in other indirect taxes, to cover part of the gross fiscal cost.
Chart C
Euro area energy compensatory measures in response to the Middle East war in 2026
a) Size and composition
(percentages of GDP)
b) Fiscal and inflation impact
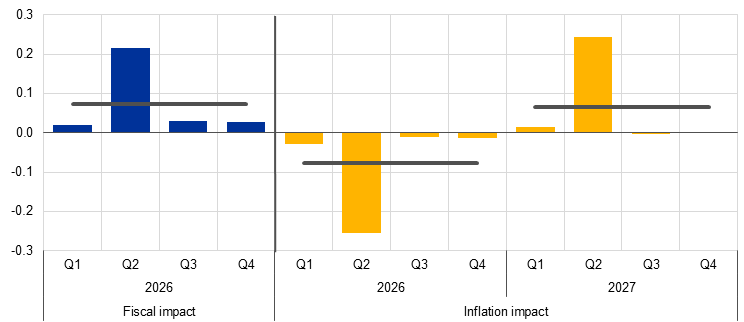
(fiscal impact: percentages of GDP; inflation impact: percentage points)
Source: June 2026 Eurosystem staff macroeconomic projections for the euro area.
Notes: Panel a): energy compensatory measures refer to measures since the onset of the Middle East war until the cut-off date for the June 2026 macroeconomic projections (27 May 2026). Panel b): gross total fiscal support and its impact on inflation. Inflation is measured by the Harmonised Index of Consumer Prices (HICP). The bars denote the year-on-year impact for each quarter and the lines denote the average annual impact.
So far, the new fiscal measures are concentrated in the second quarter of 2026, with a temporary downward impact on inflation (Chart C, panel b). In many countries the new discretionary fiscal policy measures were initially approved for only a few months, although a few extensions have been announced. At the cut-off date for the June 2026 projections, Eurosystem staff estimated a reduction in year-on-year HICP inflation of around 0.2 percentage points in the second quarter of 2026, with a comparable increase in the second quarter of 2027 owing to the temporary nature of the fiscal measures.
The scope for self-financing current or future discretionary energy measures through inflation-driven revenues is likely to remain limited. Earlier Eurosystem analysis concluded that energy supply shocks are unlikely to deliver short‑term boosts to revenue‑to‑GDP ratios and that public expenditure pressures are expected to increase over the medium term.[4] Following an adverse oil supply shock (and in the absence of energy compensatory measures), tax revenues might initially benefit from higher energy prices and nominal tax bases. However, these gains are likely to be gradually offset as inflation erodes disposable incomes and thus depresses private consumption. Following large adverse oil supply shocks in the past, indirect tax‑to‑GDP ratios developed very heterogeneously across euro area countries but there was no general upward trend at the euro area aggregate level over subsequent quarters (Chart D, panel a).[5]
Chart D
Tax developments in the euro area after large adverse oil supply shocks
a) Changes in indirect tax-to-GDP ratio after past large oil supply shocks across euro area countries and at the euro area aggregate level
(percentage points of GDP)

b) Recent VAT collection
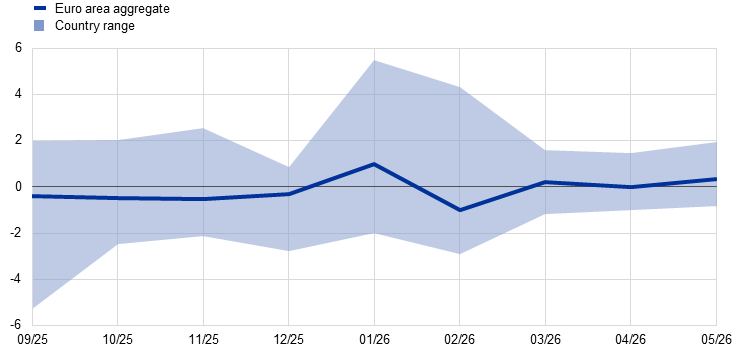
(percentage point deviations from previous ten-month average)
Sources: Eurostat, June 2026 Eurosystem staff macroeconomic projections for the euro area, Haver Analytics and ECB staff calculations.
Notes: Panel a): changes in indirect tax ratios after past large oil supply shocks, compared with average ratios in the four pre-shock quarters. The dots denote euro area countries and the lines denote the euro area aggregate. Data are winsorized at the 1st and 99th percentiles. Panel b): deviations of monthly year-on-year VAT growth from historical norms using ten-year rolling distributions scaled by the standard deviation. The period from March 2020 to June 2021 has been excluded from the ten-year average owing to significant volatility in VAT collection during this time. In both panels, the euro area aggregate is the GDP-weighted average across euro area countries.
So far in 2026, VAT data at the euro area level show no evidence of higher revenues following the increase in oil prices (Chart D, panel b). From March to May 2026, VAT revenues across countries remained within their historical ranges. Other indirect tax revenues, such as excises on fuels, are likely to be negatively affected following the reduction in tax rates in many countries and the fact that they are levied on quantities and not on values affected by higher prices.
Looking forward, the recent energy price shock poses challenges for fiscal policies. Fiscal space is currently more limited than in the past and there is little scope for self-financing discretionary energy support. Recalling that fiscal sustainability is a crucial anchor for broader economic stability, fiscal support should therefore be temporary, targeted and tailored. This may be even more important now given the need to preserve fiscal space and the signal in energy prices, while protecting the most vulnerable households and firms.
References
Arce, Ó., Battistini, N., Bouabdallah, O., Lis, E. and Mohr, M. (2026), “A tale of two energy crises – initial conditions matter”, The ECB Blog, ECB, 3 June.
Bańkowski, K., Bouabdallah, O., Checherita-Westphal, C., Freier, M., Jacquinot, P. and Muggenthaler, P. (2023a), “Fiscal policy and high inflation”, Economic Bulletin, Issue 2, ECB.
Bańkowski, K., Checherita-Westphal, C., Jesionek, J. and Muggenthaler, P. (2023b), “The effects of high inflation on public finances in the euro area”, Occasional Paper Series, No 332, ECB, December.
Burriel Llombart, P., Odendahl, F. and Párraga Rodríguez, S. (2024), “Asymmetries in the transmission of energy price increases and decreases to underlying inflation in the euro area and Spain”, Economic Bulletin, Issue 2024/Q1, Banco de España.
Checherita-Westphal, C. (2023), “The impact of discretionary fiscal policy measures on real GDP growth from 2020 to 2022”, in De Santis, R.A. and Stoevsky, G., “The role of supply and demand in the post-pandemic recovery in the euro area”, Economic Bulletin, Issue 4, ECB.
European Central Bank (ECB) (2025), “A strategic view on the economic and inflation environment in the euro area”, Occasional Paper Series, No 371, ECB, June.
Gazzani, A., Venditti, F. and Veronese, G. (2024), “Oil price shocks in real time”, Journal of Monetary Economics, Vol. 144, May.
Legal Disclaimer:
EIN Presswire provides this news content "as is" without warranty of any kind. We do not accept any responsibility or liability for the accuracy, content, images, videos, licenses, completeness, legality, or reliability of the information contained in this article. If you have any complaints or copyright issues related to this article, kindly contact the author above.
